The Visual Revolution of Data: A Journey Unfolding Minds Through “Traffic Secrets” and “Everybody Lies”

Hello, fellow navigators of the digital ocean, where data streams meet the art of marketing and the craft of brand storytelling! Today, I’m thrilled to share a personal odyssey into the realm of data literacy, inspired by the core tenet of Russell Brunson’s “Traffic Secrets” – “traffic is people” – and the compelling insights into human nature from Seth Stephens-Davidowitz’s “Everybody Lies.” These readings sparked a mission to transform raw data into compelling visual narratives, making the intricacies of human behavior accessible and understandable to all.
Data can often appear as an impenetrable fortress of numbers. However, as “Traffic Secrets” underscores, behind every click and session lies a real person. And as “Everybody Lies” reveals, their online actions often betray their truest desires. It’s in this intersection that I found the impetus to leverage the captivating power of data visualization, aiming to bridge the gap between cold statistics and warm human understanding.
Exploring the Mind’s Landscape: The “What is in mind” Chart
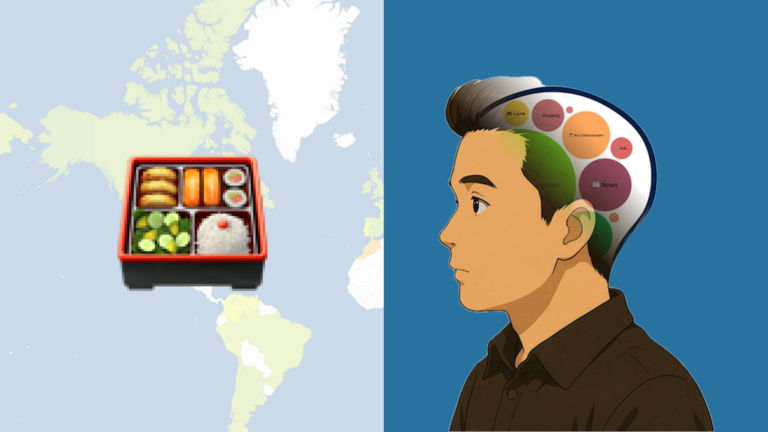
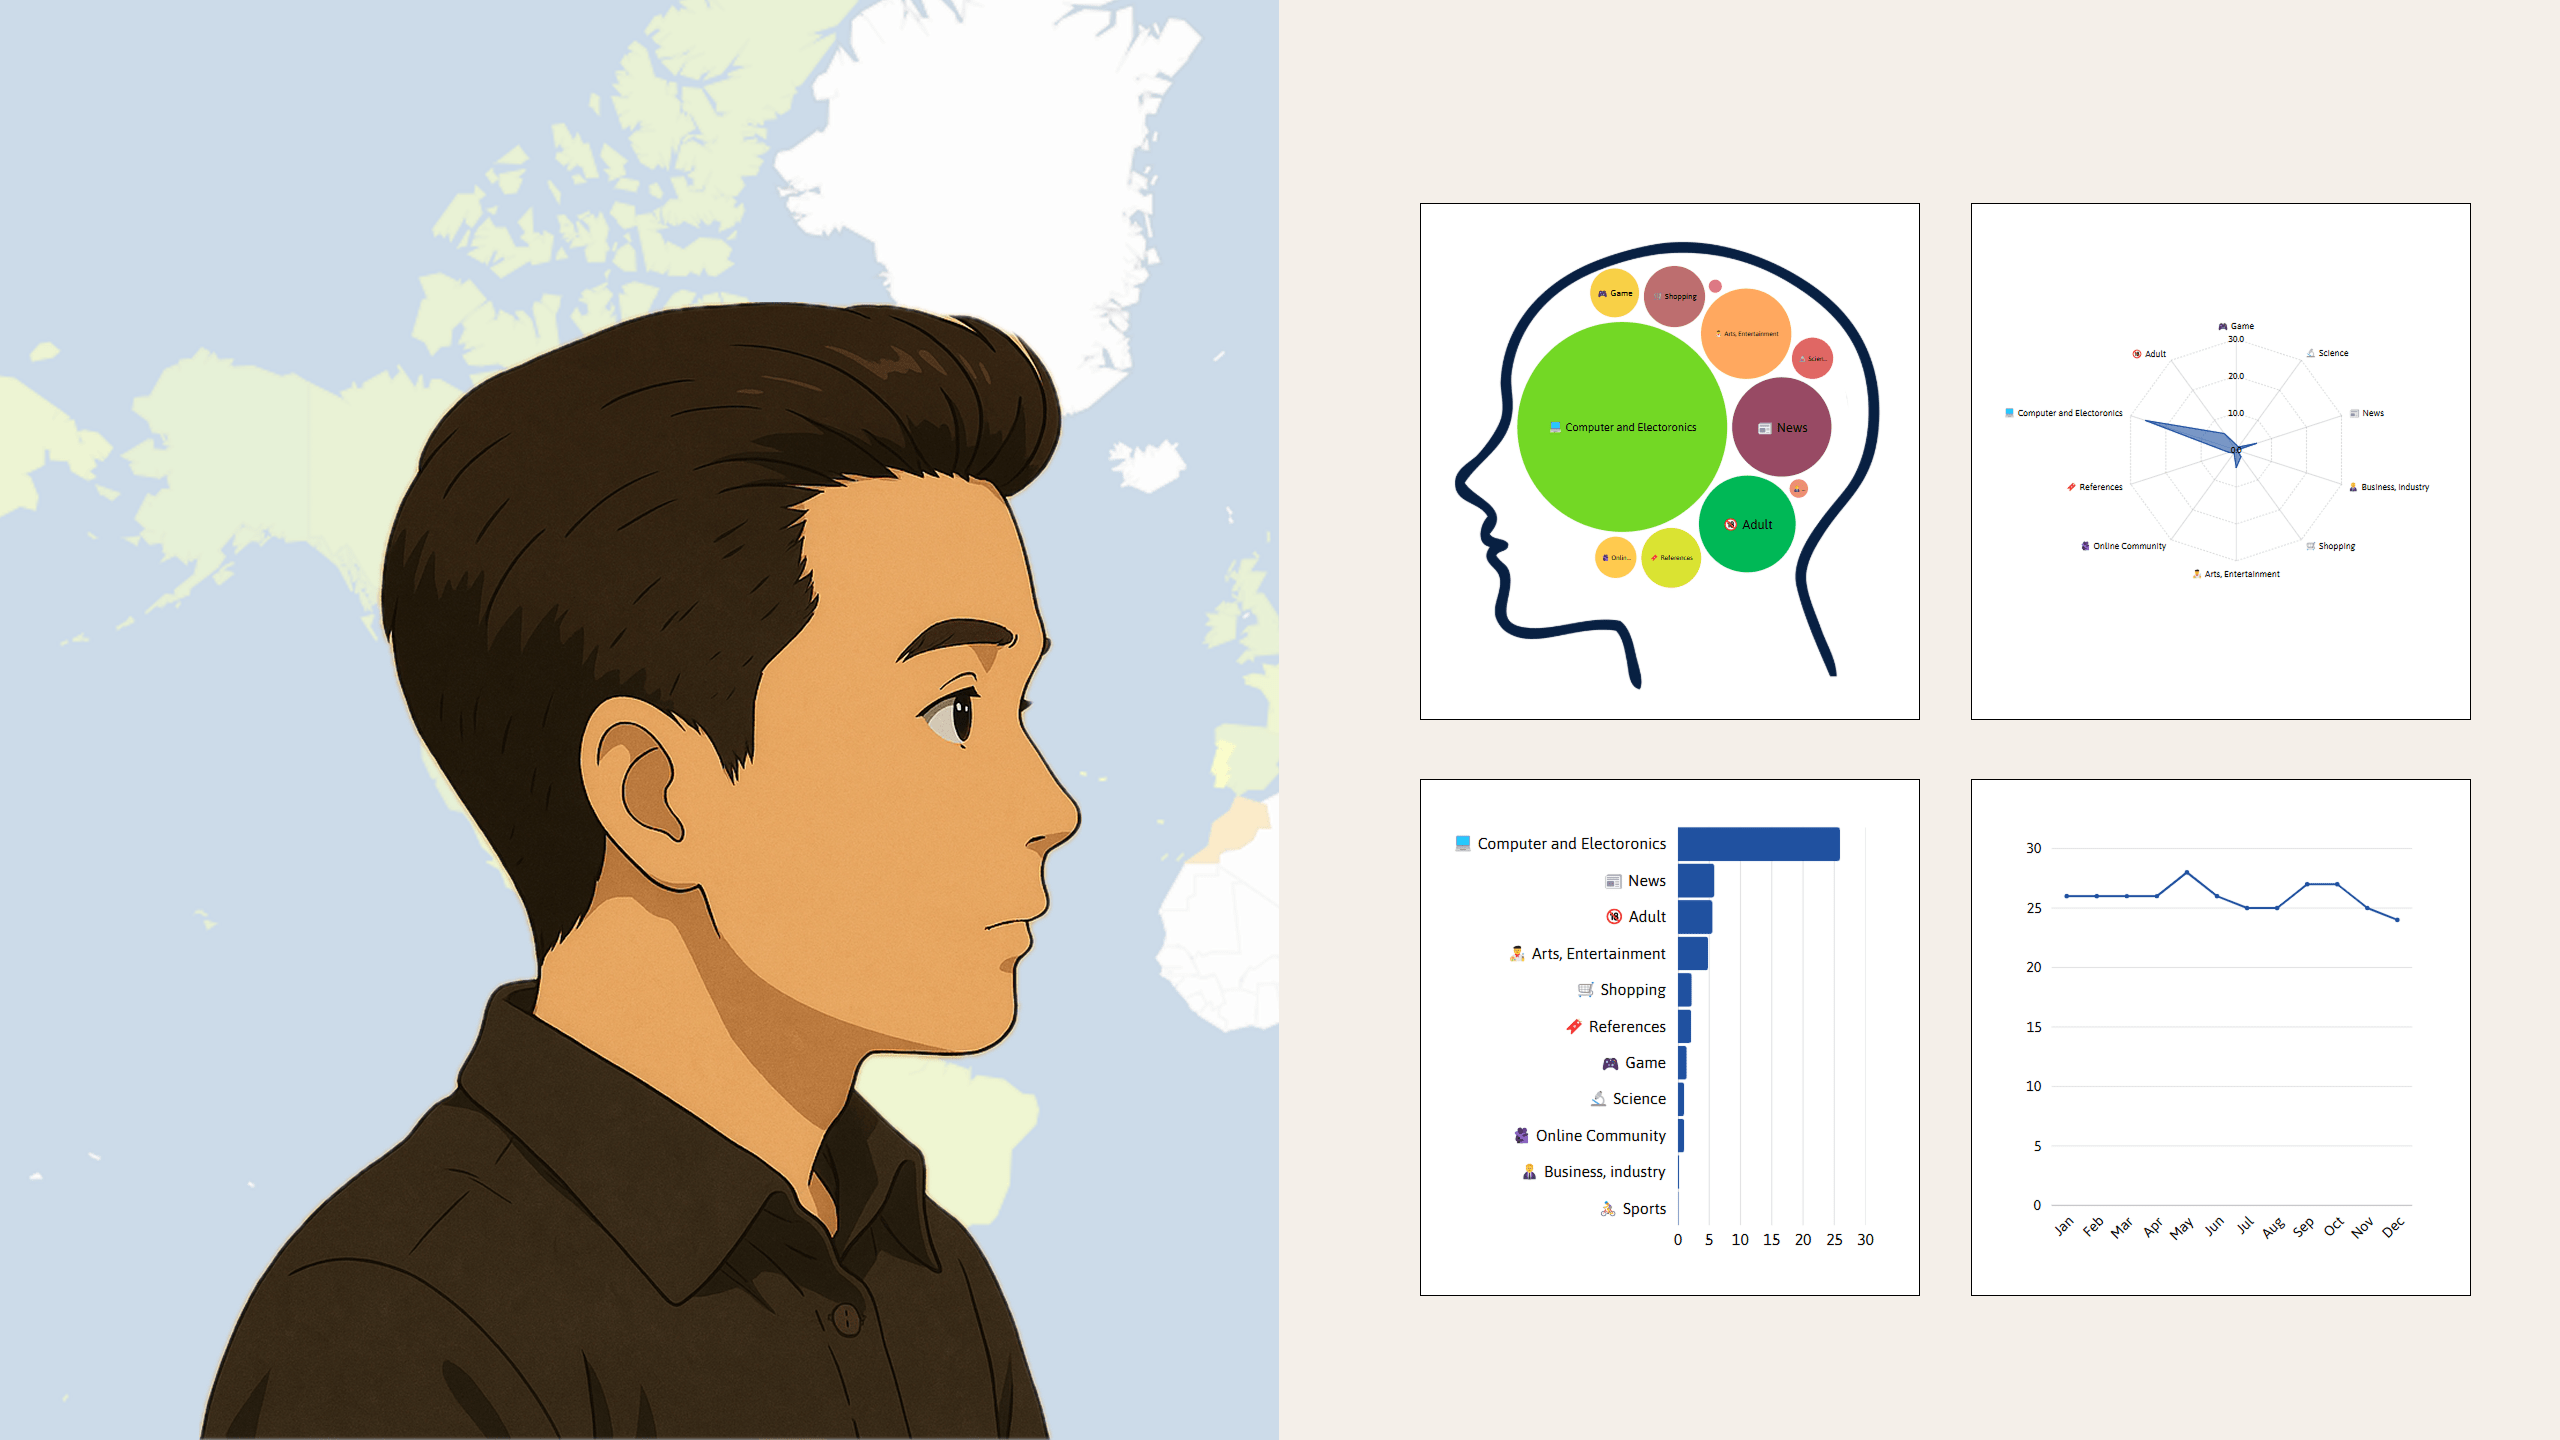
Our first visual exploration is the “What is in mind” chart. This unique creation blends a Circle Packing structure with the outline of a human head, mirroring the intricate pathways of a brain’s mind map. The size of each circle intuitively represents the level of interest in a specific content category within a given region, while a spectrum of colors provides immediate visual differentiation between content types.
Through the chart, you can directly perceive which content categories occupy a larger ‘mind space’ across different geographical areas – essentially, what captures their primary attention. For instance, the ‘Computer and Electronics’ category might dominate in one region, while ‘Arts, Entertainment,’ or ‘Shopping’ might take precedence in others. This visual clarity transcends the limitations of numerical data, offering an immediate grasp of regional focal points.
The Radar of Diverse Interests: Top 10 Content Categories Chart
Next, we delve into the “Top 10 Content Categories” chart. Utilizing a Radar Chart (spider chart), this visualization offers a multi-dimensional comparison of the top 10 content interest patterns across various regions. Each content category is positioned along a radial axis, and the degree of interest is marked and connected, forming a distinctive radar-like pattern.
By examining this chart, you can swiftly identify which content categories garner relatively high interest within each region and discern the varying distributions of these interests. One region might exhibit a balanced interest across multiple categories, while another might display a concentrated focus on specific areas. This provides crucial visual cues for understanding the nuances of online content consumption across different locales.
A Panoramic View of Popularity: Popular Content Categories Chart
The “Popular Content Categories” chart employs Bar Charts to deliver a comprehensive view of the distribution of all content categories that attract interest within each region. The length of each bar directly corresponds to the relative level of interest in that category, allowing for an immediate and intuitive comparison of content popularity across different geographical areas.
This visualization enables us to identify not only the mainstream content dominating specific regions but also niche interests gaining traction. This comprehensive overview offers invaluable insights for brainstorming new content ideas or crafting tailored content strategies for specific regional audiences.
Tracing the Ebb and Flow of Interest: Monthly Content Interest Trends
Understanding the dynamic shifts in people’s interests over time is paramount in the ever-evolving online landscape. The “Monthly Content Interest Trends” chart, powered by Line Charts, vividly illustrates the monthly fluctuations in interest for key content categories within each region. The gradient and peaks of the lines clearly depict when and how specific content categories gain or lose popularity, aiding in the analysis of external factors like seasonal changes or social events on content consumption patterns.
The Geographical Footprint of Digital Activity: Website Usage Map Chart
Finally, the Website Usage Map Chart utilizes color intensity on a geographical map to represent the volume of website usage in different regions. This provides an immediate visual understanding of the digital activity level in specific areas, offering valuable insights for identifying high-potential digital marketing regions or formulating global expansion strategies.
Beyond Data Illiteracy: Embracing the Era of Visual Insight
This journey of reinterpreting data through the lens of diverse visualization techniques has offered me a profound opportunity to connect with the ‘people’ behind the traffic, echoing the wisdom of “Traffic Secrets.” The deep curiosity about human psychology ignited by “Everybody Lies” has found clearer pathways through the illuminating power of visual data.
Data doesn’t have to be an intimidating barrier. When adorned with the visual language of charts and graphs, it transforms into a potent tool for telling compelling stories. Through this blog post, I sincerely hope to inspire you to shed any apprehension towards data, experience the joy of understanding it visually, and embark on your own journey towards enhanced data literacy – a crucial skill for navigating and understanding our increasingly data-driven world. Data is no longer the sole domain of experts; it’s a powerful instrument for enriching the insights of us all.